Online Documentation for SQL Administrator for SQL Server
Performance
The Performance section of the Server Explorer allows you to manage:
- OS Processes
- Server Processes
- Locks
- Performance Counters
- Collected Statistics
- Collected Statistics Trend
- Index Physical Stats
- Missing Indexes
Use the toolbar items to manage the displayed statistics:
![]() collect statistics automatically
collect statistics automatically
![]() don't collect statistics when the view is not active
don't collect statistics when the view is not active
- Collect Interval, sec - when the statistics is collected automatically this value determines the frequency of the statistics collection
- Chart Range, min - this value determines the range of every chart
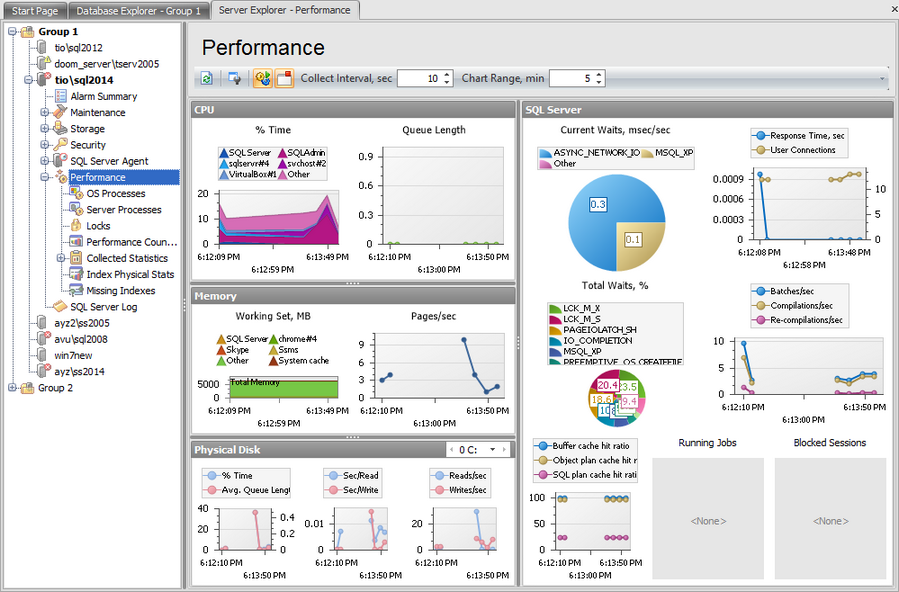
The work area of the Performance tab contains several sections with graphics and diagrams which are the visual representation of several of the CPU, Memory, Physical Disk and SQL Server counters.
CPU
% Time
This graphic provides a measure of how much time the processor actually spends working on productive threads and how often it was busy servicing requests. This counter actually provides a measurement of how often the system is doing nothing subtracted from 100%. Above the graphic you can see which processes are shown on the graph.
Queue Length
This diagram shows how many threads (vertically) are ready in the processor queue, but not currently able to use the processor.
Memory
Working set, MB
This graphic shows which part (in MB) of the total memory is taken by the processes with the highest memory consumption. These processes are listed above the graphic.
Pages/sec
This diagram is a general indicator of how often the system is using the hard drive to store or retrieve memory associated data.
Physical Disk
This section displays several diagrams of the selected physical disk performance.
% Time
Shows the percentage of elapsed time that the selected disk drive was busy servicing read or write requests.
Avg. Queue Length
Presents the average number of both read and write requests that were queued for the selected disk during the sample interval.
Sec/Read
Shows the average time (in seconds) of a read of data from the disk.
Sec/Write
Displays the average time (in seconds) of a write of data to the disk.
Reads/sec
Presents the rate of read operations on the disk.
Reads/sec
Presents the rate of write operations on the disk.
SQL Server
Two circular diagrams show Current (msec/sec) and Total (%) waits. The list of waits is shown above the diagram.
Response Time, sec
This counter shows server response time (in seconds) when executing an SQL statement (the left vertical axis).
User Connections
Shows the number of users currently connected to the system (the right vertical axis).
Batches/sec
Presents the number of Transact-SQL command batches received per second. This statistic is affected by all constraints (such as I/O, number of users, cache size, complexity of requests, and so on). High batch requests mean good throughput.
Compilations/sec
Displays the number of SQL compilations.
Re-compilations/sec
Shows the number of SQL re-compiles.
Buffer cache hit ratio
Presents the percent of pages that were found in the buffer pool without having to incur a read from disk.
Object plan cache hit ratio
Displays the ratio between procedures, functions and triggers plans cache hits and lookups.
SQL plan cache hit ratio
Shows the ratio between SQL statements or batches plans cache hits and lookups.
Running Jobs
This list displays jobs that are currently running on the server.
Blocked Sessions
When a process is blocked it waits on the blocking process to finish before it continues execution. This can result in long running. In other words, SQL Server often intentionally prevents one process from accessing an object if another process has a lock on it. This means the second process is blocked from continuing until the first process releases the lock on the object to which the second process needs access.
|
Availability: |
|
|
Full version |
Yes |
|
Free version |
No |
|
Note: To compare all features of the Full and the Free versions of SQL Administrator, refer to the Feature Matrix page. |
|
|
See also: |


