
Online Documentation for SQL Administrator for SQL Server
Server Processes
This node of the Performance section displays all system and non-system processes running on the server. Here you can view properties of current processes.
Using the context menu of the selected process or toolbar buttons you can:
![]() kill the process
kill the process
![]() show command text of the process
show command text of the process
![]() create and print the report
create and print the report
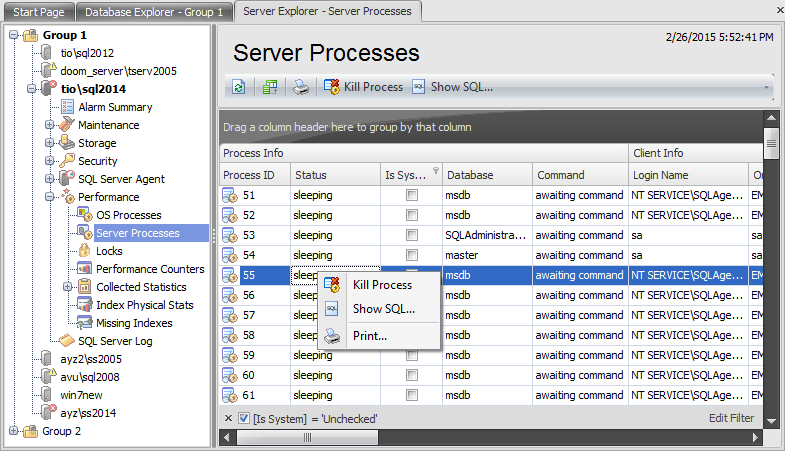
The list displays processes as a grid with the following columns: Process Info: Process ID, Status, Is System, Database, Command; Client Info: Login Name, Original Login Name, Host Name, Program Name; Locks: Blocked By, Number of Blocking Processes, Wait Time, Last Wait Type, Wait Resource; Process Statistics: CPU Time, Physical IO, Reads, Writes, Logical Reads, Memory Usage (KB), Open Transaction, Transaction Isolation Level, Row Count. If more convenient, you can change the order of the columns by dragging their headers horizontally. See the Working with grid section of the SQL Administrator documentation to find out operations that can be performed with the grid.
|
Availability: |
|
|
Full version |
Yes |
|
Free version |
No |
|
Note: To compare all features of the Full and the Free versions of SQL Administrator, refer to the Feature Matrix page. |
|


