
Online Documentation for SQL Administrator for SQL Server
Performance Counters
This node of the Performance section shows you time diagrams of the statistics collected by SQL Administrator. These diagrams are graphed on the basis of the SQL Server productivity counters values.
Statistics help you to learn about the current SQL Server productivity.
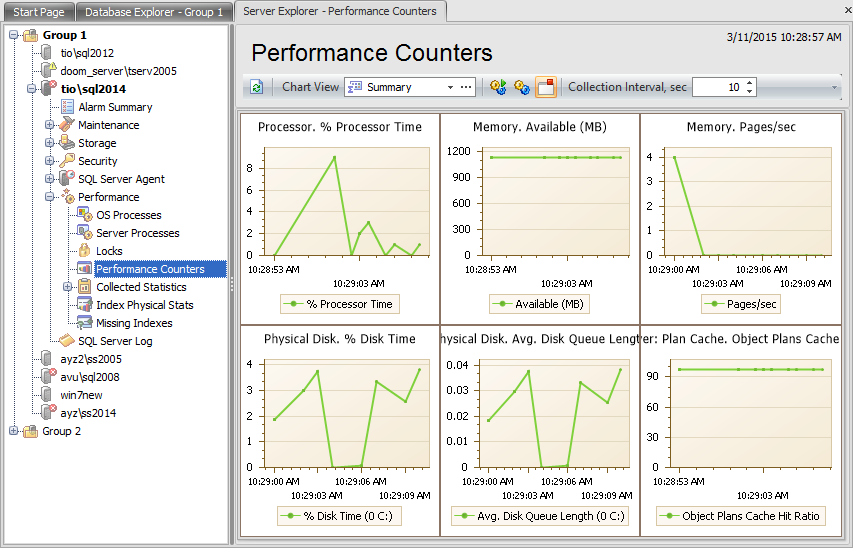
Initially the work area is separated into six sections:
- Processor. % Processor Time. It displays a diagram of the processor time, that is the percentage of time the processor is busy by measuring the percentage of time the thread of the Idle process is running and then subtracting that from 100 percent. This measurement is the amount of processor utilization.
- Memory. Available (MB). This diagram shows the amount of memory that is left after nonpaged pool allocations, paged pool allocations, process' working sets, and the file system cache have all taken their piece.
- Memory. Pages/sec. The Pages/sec diagram shows the rate at which pages are read from or written to disk to resolve hard page faults.
- Physical Disk. % Disk Time. This diagram is a general mark of how busy the disk is. It indicates a disk problem, but must be observed in conjunction with the Disk Queue Length counter to be truly informative.
- Physical Disk. Avg. Disk Queue Length. This counter converts the % Disk Time to a decimal value and displays it.
- SQL Server: Plan Cache. Object Plans Cache Hit Ratio. Ratio between cache hits and lookups.
You can enlarge the particular section by double-clicking it.
Use the toolbar items to manage the displayed statistics:
- Diagram Set - select the necessary set of the diagrams
![]() collect statistics automatically
collect statistics automatically
![]() collect statistics now
collect statistics now
![]() don't collect statistics when the view is not active
don't collect statistics when the view is not active
- Collection Interval, sec - when the statistics is collected automatically this value determines the frequency of the statistics collection
- Chart Range, min - this value determines the range of every chart
![]() set counter instance filter, i.e. set disks for some counters
set counter instance filter, i.e. set disks for some counters
![]() create and print the report
create and print the report
Click the ![]() button (in the Diagram Set field) to customize the chart view. In the window appeared you can set displayed charts and used counters.
button (in the Diagram Set field) to customize the chart view. In the window appeared you can set displayed charts and used counters.
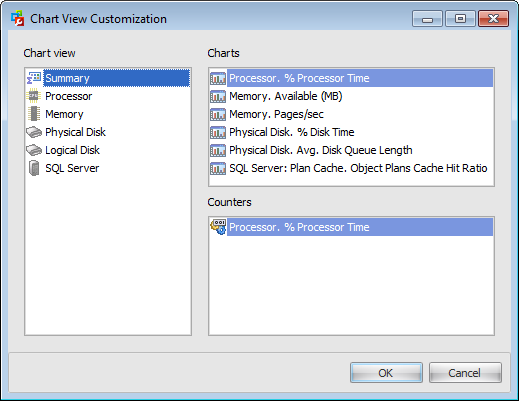
Chart view
Using this section you can set the groups of charts that then could be selected in the Diagram Set field.
The context menu of the section allows you to:
![]() create chart view
create chart view
![]() rename chart view
rename chart view
![]() delete chart view
delete chart view
![]() move up
move up
![]() move down
move down
Charts
Use this section to manage charts in the chart view:
![]() create chart
create chart
![]() rename chart
rename chart
![]() delete chart
delete chart
![]() move up
move up
![]() move down
move down
When creating a new chart the Performance Counter window appears:
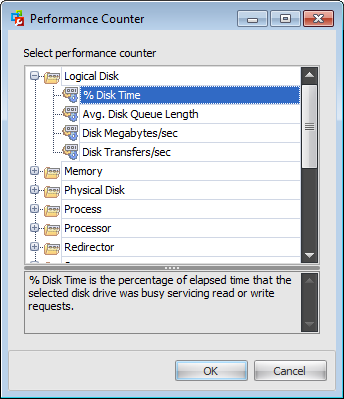
It lists groups of performance counters that help you to determine the performance of the processor, logical and physical disks, memory, server etc. To create a new chart select the necessary performance counter from the list and click the 'OK' button.
Counters
Use this section to manage performance counters of the selected chart:
![]() add counter
add counter
![]() remove counter
remove counter
![]() move up
move up
![]() move down
move down
The Performance Counter window appears on the adding a counter action.
Note: Some statistics are not collected if the WMI Connection to the server is not set.
|
Availability: |
|
|
Full version |
Yes |
|
Free version |
No |
|
Note: To compare all features of the Full and the Free versions of SQL Administrator, refer to the Feature Matrix page. |
|


