
Online Documentation for SQL Administrator for SQL Server
Collected Statistics Trend
This subnode is intended to show you diagrams which reflect the tendency of different performance counters values collected by the Statistics Collector service. This tool allows you to find counters which values have changed greatly in the defined period of time.
The work area is separated into two sections. The upper one contains the list of available counters described by the following information: Performance Group, Performance Counter, Instance, Statistics Trend. By default, the grid is sorted descending the value of a counter change (Statistics Trend).
Select the necessary counter and double-click it or use the Show Details context menu item for the lower area to display a more detailed diagram of the statistics trend.
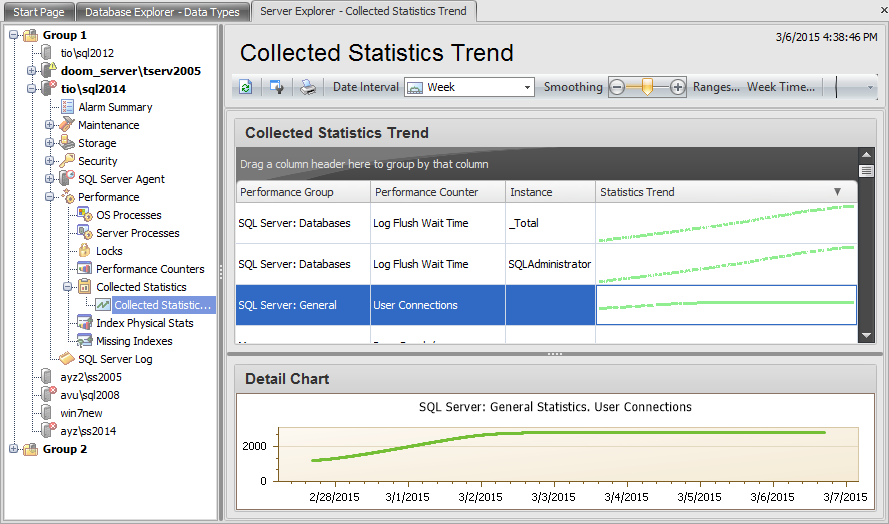
Use the toolbar items to manage the displayed statistics:
- Date Interval - select the period during which you want to view collected statistics: Day, Week, Month, Quarter or Year
- Smoothing - use the '+' / '-' buttons or just move the runner of this control to set the preferable graph smoothing
- Ranges - set the equal counter value ranges
- Week Time - set week day(s) and day time at which you want to watch the statistics trend
- Expand/Collapse all rows - use this buttons when the grouping is applied to show/hide all records
Use the ![]() Print context menu item or the corresponding toolbar button to create and print the report.
Print context menu item or the corresponding toolbar button to create and print the report.
Setting Week Time
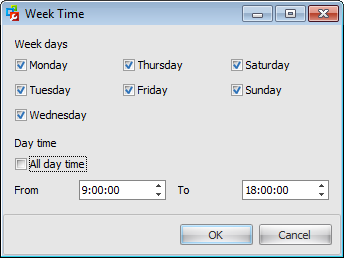
Check the days at which to show the statistics from the Week days list. Then set the Day time. You can choose to
display the statistics for the whole day or set the interval.
Setting Ranges
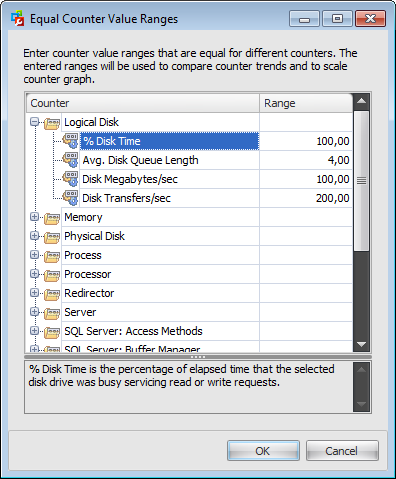
Collected Statistics Trend tool displays counter values that have different units of measure, for instance, the Avg Disk Queue Length counter usually takes on a little value whereas the Disk Transfers/sec reaches the value of 100 and more.
So values of different counters (and their changes) cannot be compared as they are.
That's why you must set the ranges of the counter changes that will be considered equal. This is done in the Equal Counter Value Ranges dialog. For example, the data on the picture show that the interval of the % Disk Time counter change from 0 to 100 is considered equivalent to the interval of the of the Avg Disk Queue Length counter change from 0 to 4 and so on. It means that the counter values are scaled with a glance to the values provided in the Equal Counter Value Ranges dialog. This is done according to the following scheme:
- The obtained value for every counter is divided by the value set in the Range column.
- The counter with the maximum change is searched for and is set on the first position in the grid.
- Other counter values are divided on the value of that maximum counter change.
- All diagrams in the grid are replotted according to the scaled values, then they are smoothed.
|
Availability: |
|
|
Full version |
Yes |
|
Free version |
No |
|
Note: To compare all features of the Full and the Free versions of SQL Administrator, refer to the Feature Matrix page. |
|


