

Online Documentation for SQL Manager for SQL server
Viewing query plan
Using SQL Manager for SQL Server, you can view the plan for each of the queries created and executed in the application. The query plan is available within the corresponding Plan tab.
To view the Plan of a query, open the query in Query Data and use the ![]() Show estimated execution plan item of the Navigation bar or toolbar.
Show estimated execution plan item of the Navigation bar or toolbar.
The Plan tab allows you to view the sequence of actions performed by the database server in the process of the query execution, and the amount of system resources used for the query execution.
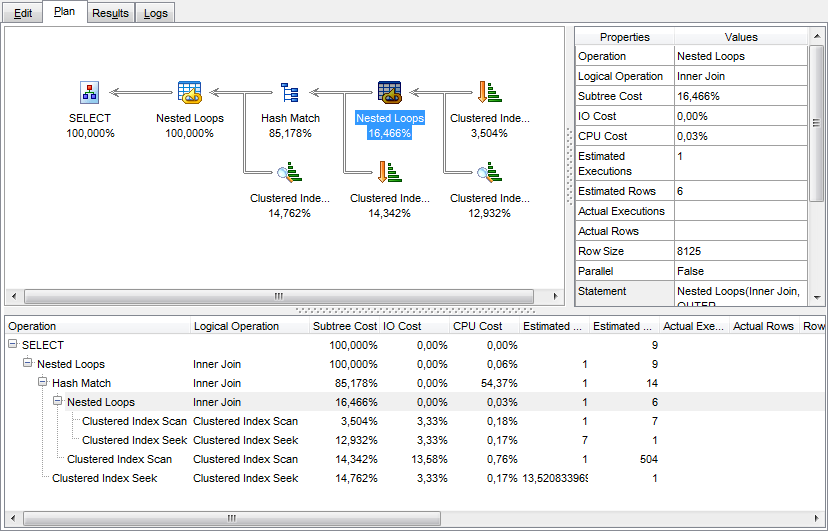
The Operation panel below displays the operations as a tree list with the following columns: Operation, Logical Operation, Subtree Cost, IO Cost, CPU Cost, Estimated Executions, Estimated Rows, Actual Executions, Actual Rows, Row Size, Parallel, Statement, Argument, Defined Values, Output, Warnings.
Right-click within the panel to display the context menu allowing you to configure the set of visible columns or export the plan to any of supported formats.
If necessary, you can specify that the Plan tab appears automatically upon query execution in Query Data: select the ![]() Show actual execution plan on query execution option available within the Tools | Query Data section of the Environment Options dialog.
Show actual execution plan on query execution option available within the Tools | Query Data section of the Environment Options dialog.
|
See also: |


