

Online Documentation for SQL Administrator for SQL Server
Alarm summary
This page displays detailed information about all occurred alarms.
Alarm summary can be evoked via the Alarm Summary item of the Server Explorer or using the Tools | Alarm Summary main menu item. In the latter case it will be opened in the separate Alarm Summary tab where you can view a grid containing fired alarms for all servers at once.
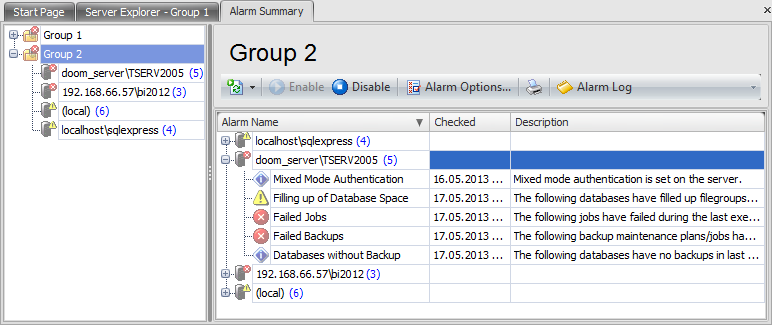
To view a detailed alarm summary for a particular server select it in the Server Explorer.
The Toolbar provides quick access to tools implemented for working with alarms.
![]() mark to refresh the list of alarms. All alarms will be placed in a queue and then refreshed. By pressing the arrow-down button you can choose the alarms you want to refresh.
mark to refresh the list of alarms. All alarms will be placed in a queue and then refreshed. By pressing the arrow-down button you can choose the alarms you want to refresh.
![]() enable alarm summary
enable alarm summary
![]() disable alarm summary
disable alarm summary
![]() view and set alarm options
view and set alarm options
![]() print the list of alarms
print the list of alarms
![]() view alarm log
view alarm log
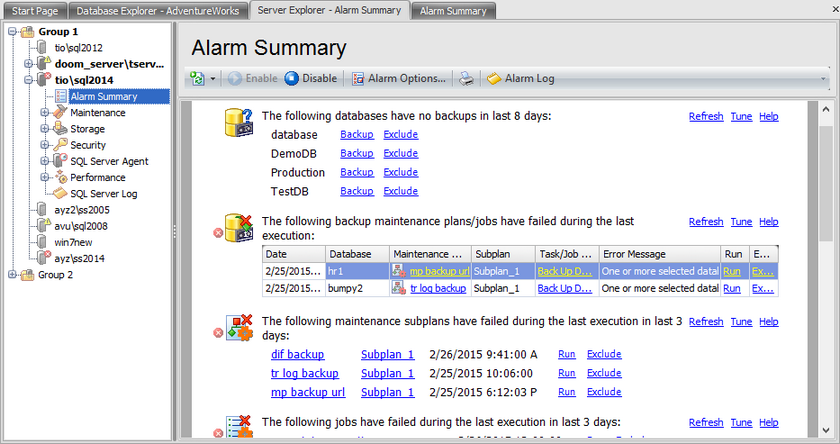
Every alarm has the following set of buttons:
Refresh - refresh the particular alarm;
Tune - set parameters for the particular alarm;
Help - view help documentation.
Some alarms contain the list of objects with detected mistakes. For every object there is an action that allows you to eliminate the occurred problem.
Here are some alarms with specific solutions:
![]() Databases without Backup
Databases without Backup
It notifies you about databases that had no backups within the defined check period. To solve this problem use the Backup button which launches the Backup Database Wizard.
![]() Failed jobs
Failed jobs
This alarm appears when a job has failed during its last execution within the check period. Click the Run button to repeat the job execution and see whether the occurred problem has been solved.
Note: To execute a job you need to run SQL Server Agent service on the server.
![]() Failed backups
Failed backups
This alarm shows a table of backup jobs and maintenance plans that have failed during the last execution. You can launch the Job Editor or Maintenance Plan Editor by clicking its name in the Job / Maintenance Plan column or launch the Step Editor / Task Editor by clicking its name in the Task/Job Step column.
Also you can run the necessary job immediately by clicking the Run button in the Run column.
Note: To execute a job you need to run SQL Server Agent service on the server.
![]() Failed Maintenance Plans
Failed Maintenance Plans
This alarm lists the subplans that have failed up during the last execution within the check period. By clicking the maintenance plan name you can open the Maintenance Plan Editor, by clicking the Subplan name you can open the Managing tasks section of the Maintenance Plan Editor. You can execute the necessary maintenance plan by clicking the Run button as well.
![]() Filling up of Database Space
Filling up of Database Space
This alarm shows databases that have filled up filegroups. It appears when the the filegroup filling exceeds the defined percentage value. By clicking the Edit button in the corresponding cell you can edit the filegroup size in the opened Database Editor.
![]() Guest Enabled Databases
Guest Enabled Databases
This alarm shows a list of databases which enable guest user connection. You can disable this connection by pressing the Disable guest button.
![]() Orphaned Logins
Orphaned Logins
This alarm shows a list of orphaned logins. You can edit a login in the Login Editor or drop it.
![]() Orphaned Users
Orphaned Users
This alarm appears when a database user becomes orphaned. You can edit a user in the User Editor so as it will not be orphaned (specify the SQL Server login for which the database user is being created) or drop the selected user.
![]() Mixed Mode Authentication
Mixed Mode Authentication
This alarm informs you that the server authentication is set to a mixed mode, i.e. Windows and SQL Server authentication mode. To configure this setting click the Modify button and change the authentication mode in the opened Server properties dialog.
![]() Ole Automation Procedures Enabled
Ole Automation Procedures Enabled
This alarm informs you that Ole Automation Procedures are enabled on the server. Click the Disable button to open the Server properties dialog and disable this option.
![]() xp_cmdshell Enabled
xp_cmdshell Enabled
This alarm appears when xp_cmdshell procedure is enabled on the server. Click the Disable button to open the Server properties dialog and disable this option.
![]() Low Buffer Cache Hit Ratio
Low Buffer Cache Hit Ratio
This alarm informs you that buffer cache hit ration is low (lower than Min Buffer Hit Ratio). Tune the Server Properties to eliminate the problem.
![]() Errors in Server Error Log
Errors in Server Error Log
This alarm appears when the error specified in the Search for field is found in the SQL Server Error Log. The full text of the error is shown in the Message column.
![]() Databases in Restricted User Mode
Databases in Restricted User Mode
This alarm raises when there are databases on the server that have the user access set to the restricted user mode. By clicking the database name you can open the Database Editor and change the user mode option on the Options tab.
![]() Databases in Non-online State
Databases in Non-online State
This alarm informs you that there are databases that are not in Online state. It shows databases that are in Offline or Emergency state. By clicking the database name you can open the Database Editor and change the database state option on the Options tab, if possible.
Some alarms have the Exclude button which allows you to delete an object from alarm summary in case you do not want to be alarmed about its possible malfunction.
Note: The following alarms require WMI Connection: SQL Server Agent Stopped, CPU Overload, Lack of Memory, Busy Disks, Large Disk Queue.
The full list of alarms can be found here.
|
See also: |


