Online Documentation for SQL Manager for Oracle
Process
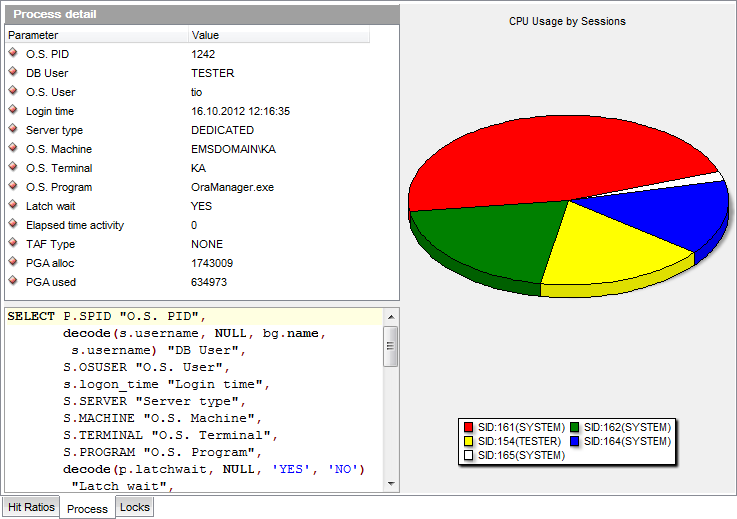
The Process tab provides details on processes and displays CPU usage by sessions graphically.
Process detail
The list displays process details as a grid with the following columns: Parameter, Value. If more convenient, you can change the order of the columns by dragging their headers horizontally.
Click a column caption to sort items by values of this column in the ascending or the descending mode.
The list displays process details for the selected session: O.S. PID, DB User, O.S. User, Login time, Server type, O.S. Machine, O.S. Terminal, O.S. Program, Latch wait, Elapsed time activity, TAF Type, PGA allocated, PGA used.
The editor area below displays the last cached query to the system view for the specified session.
CPU Usage by Sessions
The diagram area provides visual representation of CPU usage by sessions.
|
See also: |


