
Online Documentation for SQL Manager for SQL server
Debugging T-SQL
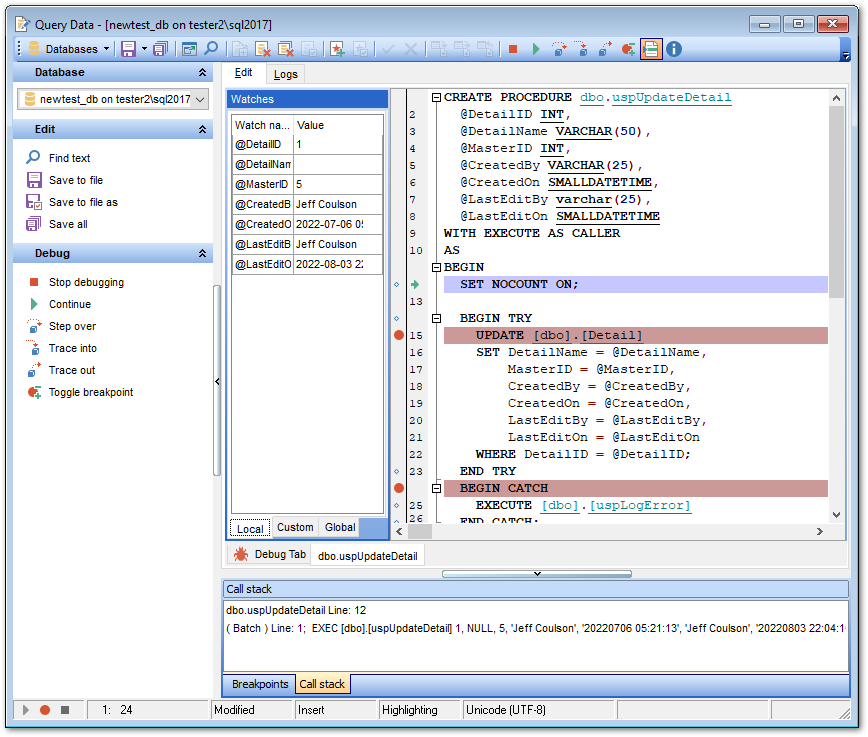
T-SQL Debugger is the cutting edge feature of SQL Manager for SQL Server. This tool is provided for step-by-step code debugging of SQL scripts, procedures, UDFs. Much of the power of the debugger comes from toggling breakpoints, getting variables' values, and fetching call stacks.
Note: For debugging on the remote server the host that is running the instance must be configured as follows http://msdn.microsoft.com/en-us/library/cc646024.aspx.
The Edit tab of the T-SQL Debugger window contains the following areas:
- the Debug panel of the Navigation bar;
- the Watches list;
- the T-SQL code area;
- the Call stack box;
- the Breakpoints list.
Note: All areas within the Edit tab of the PL/SQL Code Debugger window are dockable, i.e. you can drag an area to any location within the parent form.
The Logs tab of the PL/SQL Code Debugger window displays the debug log.
![]() Start: this command is used to start the debugging session;
Start: this command is used to start the debugging session;
![]() Break: this command stops the current debugging session;
Break: this command stops the current debugging session;
![]() Continue: use this command to continue execution up to the next breakpoint;
Continue: use this command to continue execution up to the next breakpoint;
![]() Step over: traces the code disregarding the object body (procedure, UDF);
Step over: traces the code disregarding the object body (procedure, UDF);
![]() Trace into: traces the code using the object body (procedure, UDF);
Trace into: traces the code using the object body (procedure, UDF);
![]() Trace out: traces the code up to the point of leaving the object body (procedure, UDF);
Trace out: traces the code up to the point of leaving the object body (procedure, UDF);
![]() Toggle breakpoint: use this command to add/remove breakpoints;
Toggle breakpoint: use this command to add/remove breakpoints;
![]() Clear watches: allows you to clear the variables added to the Watches list.
Clear watches: allows you to clear the variables added to the Watches list.
The T-SQL code area presents the statement being debugged. All points that have been set within the code are marked with corresponding signs. Active breakpoints are highlighted red, and inactive breakpoints are highlighted green.
The Watches list allows you to watch (on the Local tab) the variables that have been declared in the code, and the value of each variable. The following attributes are listed for each watched variable:
Watch name
Value
To add custom watch proceed to the Custom tab and specify the watch name. You can delete the selected watch by using the Ctrl+U shortcut.
Use the Global tab to view values of the server global variables.
The Call stack box lists the call stacks, if applicable.
The Breakpoints list displays the currently toggled breakpoints. The following attributes are listed for each breakpoint:
Status
Line
Owner
Name
Using the context menu you can enable/disable the selected breakpoint or delete it.


