Online Documentation for SQL Manager for InterBase/Firebird
Debugging procedure/trigger
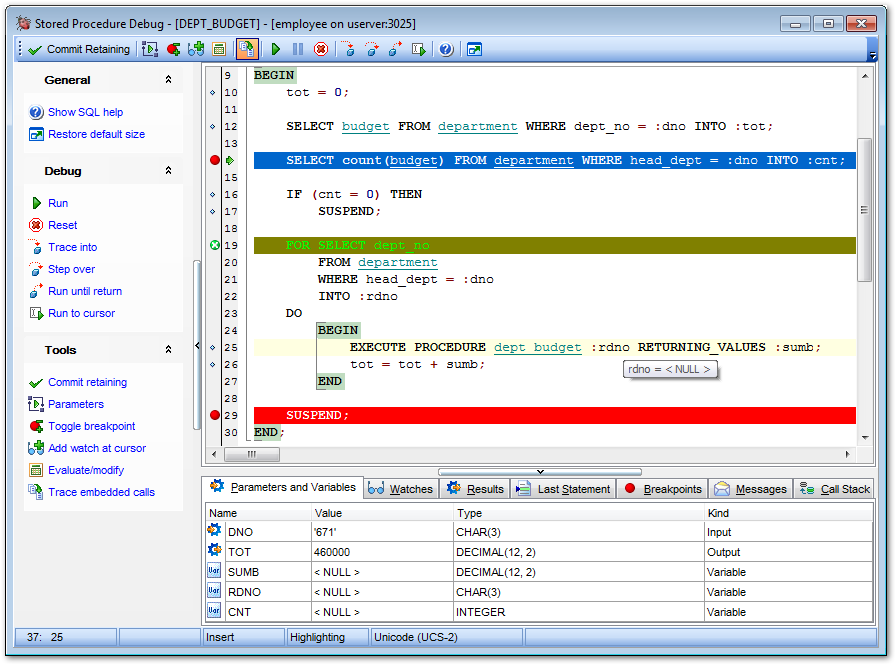
The working area allows you to view the text of procedure/trigger definition.
The red spots (![]() ) at the left of the workspace and red highlight stand for enabled breakpoints;
) at the left of the workspace and red highlight stand for enabled breakpoints;
the green spots (![]() ) and green highlight stand for disabled breakpoints;
) and green highlight stand for disabled breakpoints;
the green arrow (![]() ) and blue highlight indicate the currently executed statement.
) and blue highlight indicate the currently executed statement.
For your convenience the following shortcuts are implemented:
- To start executing the procedure step-by-step, press F8.
- To trace into a procedure that is called from the current procedure, press F7.
- To reset the procedure execution, press the Ctrl+F2 key combination.
- To add/remove a breakpoint to/from the current statement, press the Ctrl+F8 key combination.
- To run the procedure (to the end or to the next breakpoint), press F9.
Set mouse cursor over a parameter to see a hint with its current value.
Hint: Click an embedded procedure (or any other object) name with the Ctrl key pressed to open the object in its editor. For details see Using object links.
The lower area of the Procedure/Trigger Debugger window allows you to browse parameters and variables, watches, results, last statement, breakpoints, messages, call stack. For details see Browsing debug information.


