Online Documentation for SQL Manager for PostgreSQL
Diagram view
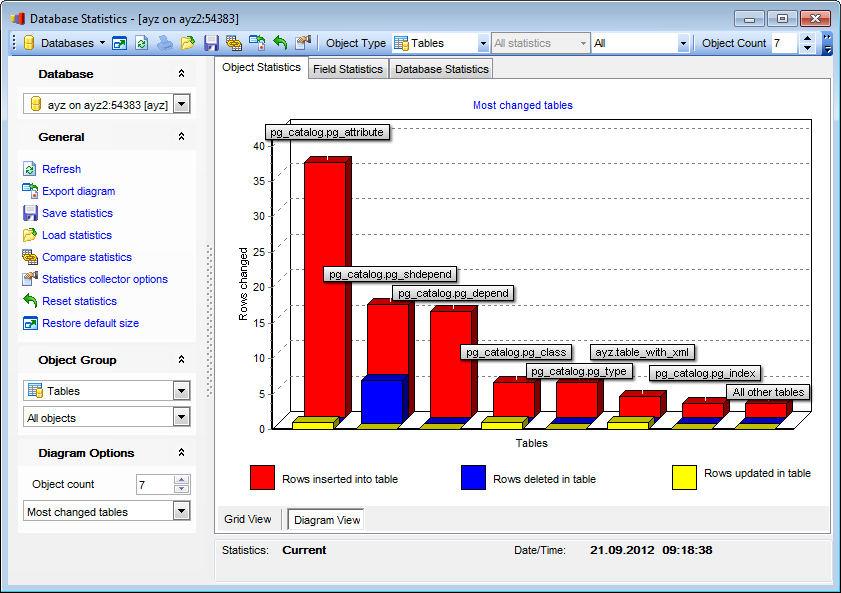
The Diagram View tab allows you to view object statistics as a diagram. To activate this type of statistics data view, select the Diagram View tab on the View mode panel at the bottom of the working area of the window.
Use the Object Group pane of the Navigation bar to select the type of objects to collect statistics for (Tables, Indices, Sequences), and whether All objects, User objects only or System objects only should be displayed.
Use the Diagram Options pane of the Navigation bar to specify common diagram options:
Object count
Use the spinner control to specify the number of objects to be displayed in the diagram.
Use the drop-down list below to select the diagram criterion:
Most frequent table scans (sequential and index), Number of scans, Updates, Inserts, Deletes, Most changed tables, Cache efficiency (for tables);
Most frequently used indices, Most frequent scans, Cache efficiency (for indexes);
Most frequent scans (for sequences).
|
See also: |


