Online Documentation for SQL Manager for PostgreSQL
Browsing Column Statistics
The Column Statistics tab displays statistical data about the contents of the database, as well as statistical data about the values of index expressions. Note that all the statistical data is inherently approximate, even assuming that it is up-to-date.
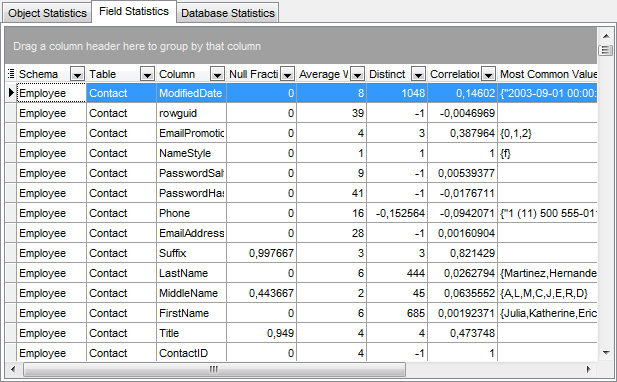
The list displays fields as a grid with the following columns:
Schema, Table, Column, NULL Fraction, Average Width, Distinct, Correlation, Most Common Values, Most Common Frequency, Histogram Bounds.
If necessary, you can group the data in grid by any of the columns. This operation is performed by dragging the column header to the gray "Group by" box area at the top. When grouping by a column is applied to the grid, all the rows are displayed as subnodes to the grouping row value. To reverse grouping, just drag the column header back. If more convenient, you can change the order of the columns by dragging their headers horizontally.
Click a column caption to sort items by values of this column in the ascending or the descending mode.
|
See also: |


