Online Documentation for SQL Administrator for SQL Server
Managing alarms
Use the Alarm Summary tab to set parameters of different alarms. An alarm is a message that informs you about possible malfunctions and potential problems on the server. All these messages are displayed in the Alarm summary window.
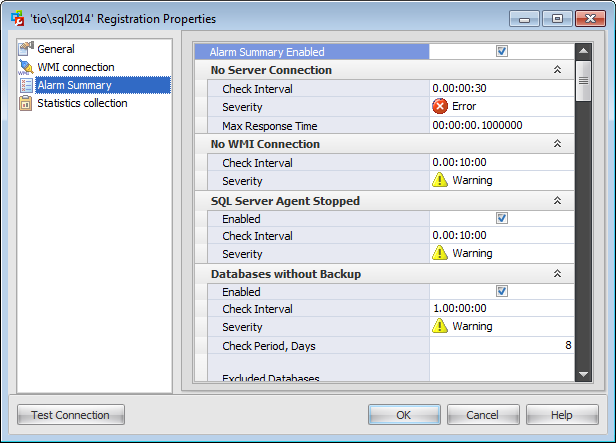
Alarm Summary Enabled
Check this option to enable alarming on all checked events.
Note: No Server Connection and No WMI Connection alarms are always enabled / disabled by this option.
Practically all alarms (except No Server Connection and No WMI Connection) have three common parameters:
![]() Enabled
Enabled
Check this option to enable alarming on the particular event.
Check Interval
Define the interval in the 'd.hh:mm:ss' format. The server will be checked on alarms occurred in the defined period of time.
Severity
Set the preferable severity degree for every alarm:
![]() Information
Information
![]() Warning
Warning
![]() Error
Error
Note: The server status is the highest severity degree of all fired alarms.
Severity degree is configured for your convenience, so as you could see these icons in the Alarm summary.
No Server Connection
This alarm warns about failed connection to the server.
Max Response Time
Define the period in the 'd.hh:mm:ss' format. If a connection timeout exceeds the defined time interval then the No Server Connection alarm appears.
No WMI Connection
This alarm appears when there is no WMI connection to get information from the server.
For more details, see WMI Connection.
SQL Server Agent Stopped
This alarm informs you that SQL Server Agent is not running and therefore scheduled jobs are not performed.
Databases without Backup
This alarm shows databases that have not been backed up during the Check Period.
Type in or use the spinner control to define the number of days to check for not backed up databases.
Excluded Databases
Enter the databases (one on the line) that you do not want to be checked for backups. The list of databases can be found here.
Failed Backups
This alarm shows backup maintenance plans/jobs that have failed during the last execution.
Excluded Maintenance Subplans
Enter the backup maintenance subplans (one on the line) which you do not want to be alarmed about in case of their failure.
Excluded Jobs
Enter the backup jobs (one on the line) which you do not want to be alarmed about in case of failure.
Failed Maintenance Plans
This alarm shows subplans that have failed up during the last execution within the Check Period.
Type in or use the spinner control to define the number of days to check for failed maintenance plans.
Excluded Maintenance Plans
Enter the maintenance plans (one on the line) which you do not want to be alarmed about in case of failure.
Failed Jobs
This alarm shows jobs that have failed up during the last execution within the Check Period.
Type in or use the spinner control to define the number of days to check for failed jobs.
Excluded Jobs
Enter the jobs (one on the line) which you do not want to be alarmed about in case of failure.
Filling up of Database Space
This alarm shows databases that have filled up filegroups.
Excluded Filegroups (database, filegroups)
Enter the database filegroups as <database_name, filegroup_name> (one on the line) that you do not want to be checked for filling up.
Type in or use the spinner control to set the maximum percentage of a filegroup filling. The alarm will appear when the filegroup filling exceeds the defined percentage value.
Guest Enabled Databases
This alarm shows databases that have guest user account enabled.
Excluded Databases
Enter the databases (one on the line) that you do not want to be checked for enabled guest user account.
Orphaned Logins
This alarm shows orphaned logins. A login can become orphaned if the corresponding Windows users or groups no longer exist. Also, a login can become orphaned after the master database transfer.
Excluded Logins
Enter the logins (one on the line) that you do not want to be alarmed about in case they are orphaned.
Orphaned Users
This alarm shows orphaned database users. A database user can become orphaned if the corresponding SQL Server login is dropped. Also, a database user can become orphaned after a database is restored or attached to a different instance of SQL Server.
Excluded Users (database, user)
Enter the database users as <database_name, database_user> (one on the line) that you do not want to be alarmed about in case they are orphaned.
Mixed Mode Authentication
This alarm informs you that the server authentication is set to a mixed mode, i.e. Windows and SQL Server authentication mode.
Ole Automation Procedures Enabled
This alarm informs you that Ole Automation Procedures are enabled on the server. Ole Automation Procedures option specifies whether OLE Automation objects can be instantiated within Transact-SQL batches.
xp_cmdshell Enabled
This alarm appears when xp_cmdshell procedure is enabled on the server. The xp_cmdshell procedure spawns a Windows command shell.
CPU Overload
This alarm appears when the CPU loading exceeds the Max CPU Usage Percent. It determines the average processor time, that is the percentage of time the processor is busy by measuring the percentage of time the thread of the Idle process is running and then subtracting that from 100 percent. This measurement is the amount of processor utilization.
Max CPU Usage Percent
Type in or use the spinner control to define the maximum percent of processor utilization.
Lack of Memory
This alarm notifies you that there is a possible lack of memory on the server and displays the current pages per second value and amount of available memory.
Max Pages per Second
Set the maximum number of physical pages read to (or written to) disk.
Min Available Memory Percent
Define the minimum percentage of available memory for the alarm to appear.
Busy Disks
This alarm shows you busy disks that have low idle time (less than Min Disk Time Percent).
Min Disk Idle Time Percent
Type in or use the spinner control to define the minimum percentage of a disk idle time for alarm to appear.
Large Disk Queue
This alarm shows disks that have high queue length (higher than Max Disk Queue Length).
Max Disk Queue Length
Type in or use the spinner control to define the maximum length of a disk queue for the alarm to appear.
High Disk Transfer Latency
This alarm raises when disk transfer latency exceeds the values specified in Max Read Time and Max Write Time. It shows current values for the read/write time.
Max Read Time
Type in or use the spinner control to define the maximum read time (in seconds) latency of a disk for the alarm to appear.
Max Write Time
Type in or use the spinner control to define the maximum write time (in seconds) latency of a disk for the alarm to appear.
Low Page Life Expectancy
Page Life Expectancy is a number of seconds a page will stay in the buffer pool without references. This alarm notifies that the page life expectancy became lower than the specified Min Page Life Expectancy.
Min Page Life Expectancy
Type in or use the spinner control to define the minimum page life expectancy (in seconds) for the alarm to appear. Note that the recommended value for this parameter is 300 seconds.
Databases in Restricted User Mode
This alarm notifies you that there are databases on the server that have the user access set to the restricted user mode.
Excluded Databases
Enter the databases (one on the line) that you do not want to be checked for the restricted user mode.
Databases in Non-online State
This alarm informs you that there are databases that are not in Online state. It shows databases that are in Offline or Emergency state.
Excluded Databases
Enter the databases (one on the line) that you do not want to be checked for the non-online state.
Errors in Server Error Log
This alarm raises when the string specified in the Search for field appears in the SQL Server Error Log. It shows the full text of the error occurred.
Enter the substring of the SQL Server error that you want to be notified about (for example, 'login failed').
Low Buffer Cache Hit Ratio
This alarm informs you that buffer cache hit ration is low (lower than Min Buffer Hit Ratio). Buffer Cache Hit Ratio is the percentage of SQL Server pages requested and retrieved from the buffer cache without reading from disk.
Type in or use the spinner control to define the minimum percentage of the buffer cache hit ratio.


