
Online Documentation for SQL Manager for Oracle
Using PL/SQL Profiler
PL/SQL Profiler provides three basic areas: Run-specific information, Information about each library unit in a run, Data from all profiler runs.
Run-specific information
The list displays profiler sessions as a grid with the following columns: Run date, Run owner, Elapsed time (msec). If more convenient, you can change the order of the columns by dragging their headers horizontally.
Click a column caption to sort items by values of this column in the ascending or the descending mode.
In order to filter items in grid, you can use Custom Filter and Filter Builder dialog. For more information refer to the Filtering records page.
Right-click an item within the list to call the context menu allowing you to delete the selected session.
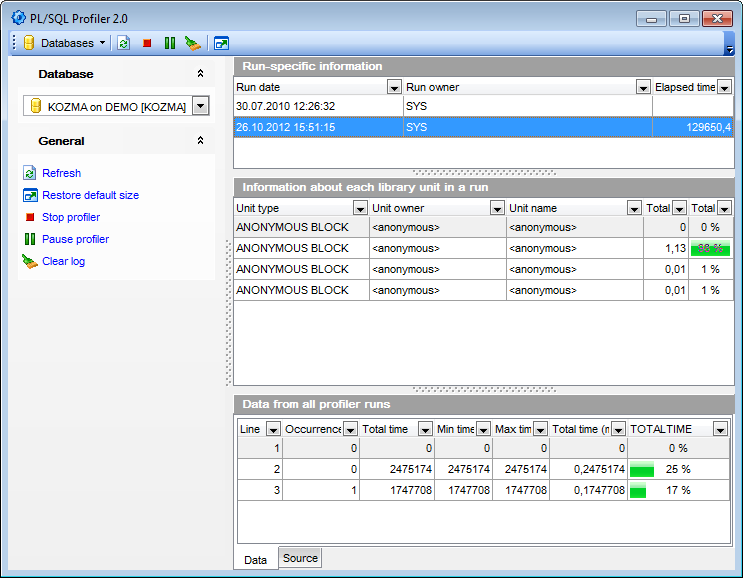
Information about each library unit in a run
The list displays extended information about each library unit as a grid with the following columns: Unit type, Unit owner, Unit name, Total time (msec), Total time. If more convenient, you can change the order of the columns by dragging their headers horizontally.
Click a column caption to sort items by values of this column in the ascending or the descending mode.
In order to filter items in grid, you can use Custom Filter and Filter Builder dialog. For more information refer to the Filtering records page.
Data from all profiler runs
This area allows you to view data from all profiler runs as a grid with the following columns: Line, Occurrences, Total time, Min time, Max time, Total time (msec), TOTALTIME. If more convenient, you can change the order of the columns by dragging their headers horizontally.
Click a column caption to sort items by values of this column in the ascending or the descending mode.
In order to filter items in grid, you can use Custom Filter and Filter Builder dialog. For more information refer to the Filtering records page.
If necessary, you can switch to the Source tab to view the source for all profiler runs.


