

Online Documentation for SQL Manager for Oracle
Using PL/SQL code debugger
PL/SQL Code Debugger is the cutting edge feature of SQL Manager for Oracle. This tool is provided for step-by-step code debugging: anonymous blocks, procedures, functions, packages, triggers, object types. Much of the power of the debugger comes from toggling breakpoints, getting variables' values, and fetching call stacks.
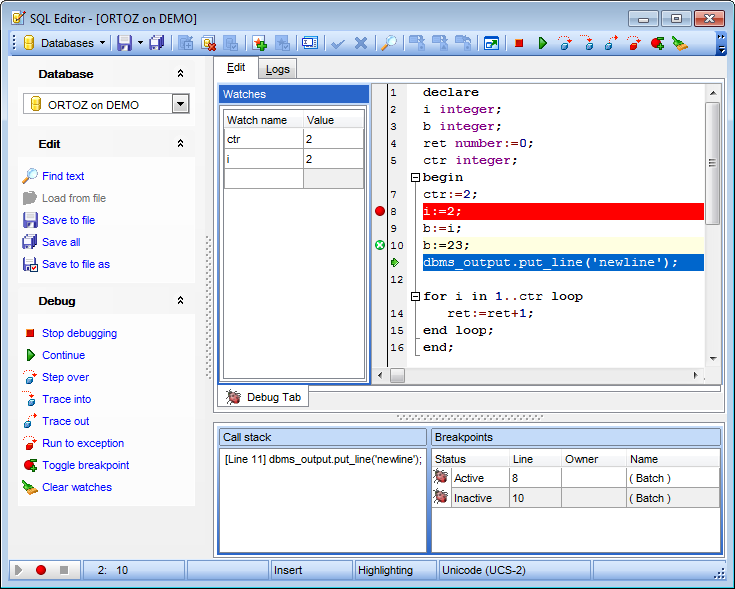
The Edit tab of the PL/SQL Code Debugger window contains the following areas:
- the Debug panel of the Navigation bar;
- the Watches list;
- the PL/SQL code area;
- the Call stack box;
- the Breakpoints list.
Note: All areas within the Edit tab of the PL/SQL Code Debugger window are dockable, i.e. you can drag an area to any location within the parent form.
The Logs tab of the PL/SQL Code Debugger window displays the debug log.
The Debug panel of the Navigation bar provides several debug commands:
![]() Start: this command is used to start the debugging session;
Start: this command is used to start the debugging session;
![]() Break: this command stops the current debugging session;
Break: this command stops the current debugging session;
![]() Continue: use this command to continue execution up to the next breakpoint;
Continue: use this command to continue execution up to the next breakpoint;
![]() Step over: traces the code disregarding the object body (procedure, function);
Step over: traces the code disregarding the object body (procedure, function);
![]() Trace into: traces the code using the object body (procedure, function);
Trace into: traces the code using the object body (procedure, function);
![]() Trace out: traces the code up to the point of leaving the object body (procedure, function);
Trace out: traces the code up to the point of leaving the object body (procedure, function);
![]() Run to exception: traces the code up to the nearest exception point;
Run to exception: traces the code up to the nearest exception point;
![]() Toggle breakpoint: use this command to add/remove breakpoints;
Toggle breakpoint: use this command to add/remove breakpoints;
![]() Clear watches: allows you to clear the variables added to the Watches list.
Clear watches: allows you to clear the variables added to the Watches list.
The Watches list allows you to watch the variables that have been declared in the code, and the value of each variable. The following attributes are listed for each watched variable:
Watch name
Value
You can delete the selected watch by pressing the Del button.
The PL/SQL code area presents the statement being debugged. All points that have been set within the code are marked with corresponding signs. Active breakpoints are highlighted red, and inactive breakpoints are highlighted green.
The Call stack box lists the call stacks, if applicable.
The Breakpoints list displays the currently toggled breakpoints. The following attributes are listed for each breakpoint:
Line
Status
Unit owner
Unit name
Compile with debug info
To debug a PL/SQL object you need it to compile it with debug info. PL/SQL objects are: packages, package bodies, procedures, functions, triggers, object types, object type bodies.


