Online Documentation for Data Export for InterBase/Firebird
Charts
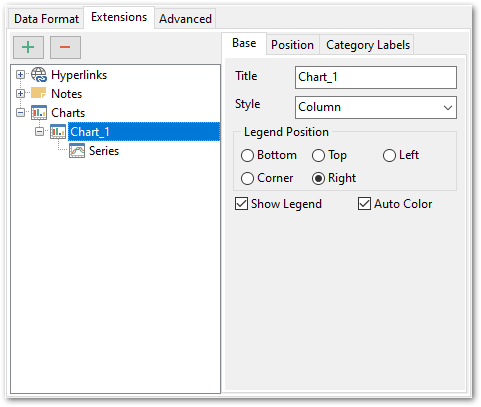
If you need to create a chart:
- enter the chart title;
- select the chart style (Column, Column 3D, Bar, Bar 3D, Line, Line Mark, Line 3D, etc.);
- set the legend position: Bottom, Top, Left, Corner or Right;
- specify if you want to show the legend;
- specify if you want to set the chart color automatically;
- define the chart position and category labels using the corresponding tabs.
Position
Position tab allows you to define chart placement and its size.
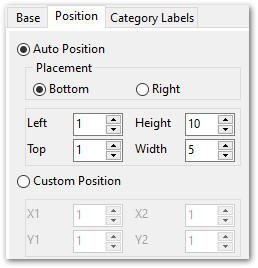
Auto Position
![]() Bottom
Bottom
The chart will be placed under the data.
![]() Right
Right
The chart will be placed to the right from the data.
You also need to specify the distance between the chart and the data at the Left and the Top fields, and chart size at the Height and the Width.
Custom Position
Specify absolute position by setting chart coordinates: X1, Y1, X2, Y2.
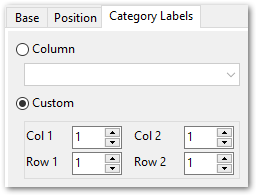
Category labels
Use this tab to define Category labels.
![]() Column
Column
Use column values as chart category labels.
![]() Custom
Custom
Define category label values range manually. Use Col 1 and Row 1 fields to specify upper left cell, and Col 2 and Row 2 fields to define the right bottom one. These cells form a square array of values that will be used as category labels.
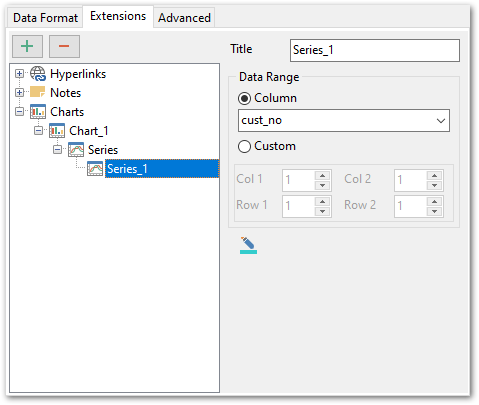
If you need to add series for the chart:
-
add one or more series using the
 button;
- enter the titles;
- set data ranges (select a column from the drop-down list or set the custom range);
- define colors for all the graphs.