

Online Documentation for SQL Query for DB2
Setting diagram properties
When in the Diagram View mode, you are provided with facilities of customizing the diagram which are available within the Diagram Control panel located to the left of the graph itself.
Diagram Title
Use this box to enter the title of the diagram being created.
Field Name
Type in or use the drop-down list to select the name of the field to be represented in the diagram.
Label Source
Type in or use the drop-down list to select the name of the field to take X-axis labels and diagram point marks from.
Diagram Type
Define the way of the diagram representation (as Bar, Line, Area, Point, Pie or FastLine).
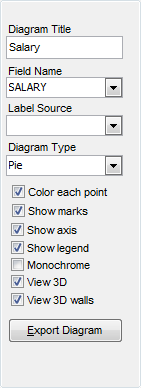
![]() Color each point
Color each point
If checked, each bar, point, line or sector of the diagram has an individual color; if not checked, all the points are colored red.
![]() Show marks
Show marks
This option defines whether the diagram point marks are visible or not.
![]() Show axis
Show axis
This option determines the visibility of the axis and the background grid.
![]() Show legend
Show legend
This property is used to specify whether the legend rectangle should be displayed on the right side of the diagram or not.
![]() Monochrome
Monochrome
Set this option to convert the colors of the diagram into the gray scale (e.g. for BW-printing).
![]() View 3D
View 3D
If this option is used, the diagram is represented as 3-Dimensional.
![]() View 3D walls
View 3D walls
If this option is used, the diagram walls are represented as 3-Dimensional.


