Online Documentation for SQL Manager for MySQL
Charts
If you need to create a chart:
- enter the chart title;
- select the chart style;
- set the legend position;
- specify if you want to show the legend;
- specify if you want to set the chart color automatically;
- define the chart position and category labels using the corresponding tabs.
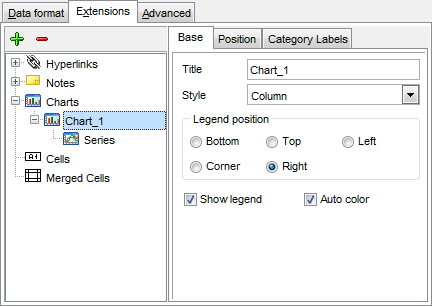
The Base tab allows you to specify basic properties of the chart to be added to the output Excel file.
Use the Title box to specify the chart name.
Use the Style drop-down list to select the preferable chart style (Column, Column 3D, Bar, Bar 3D, Line, Line Mark, Line 3D, etc.).
The Legend position group allows you to specify position of the chart legend:
![]() Bottom
Bottom
![]() Top
Top
![]() Left
Left
![]() Corner
Corner
![]() Right
Right
![]() Show legend
Show legend
This options specifies whether the chart legend will be visible or not.
![]() Auto color
Auto color
If this option is selected, each series will be automatically differentiated with different colors on the chart, otherwise one color will be applied for all series.
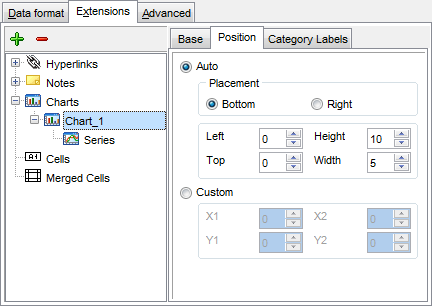
The Position tab allows you to specify properties pertaining to the chart position on the output file sheet.
![]() Auto
Auto
Specifies automatic position of the chart.
The Placement group allows you to specify the chart position relative to the data:
![]() Bottom
Bottom
![]() Right
Right
Use the Left and Top spinner controls to specify the spacing between the chart and data at the left and at the top respectively.
Use the Height and Width spinner controls to specify the chart height and width respectively.
![]() Custom
Custom
Specifies absolute position of the chart (irrelative to the data). Use the spinner controls to set the coordinates you need.
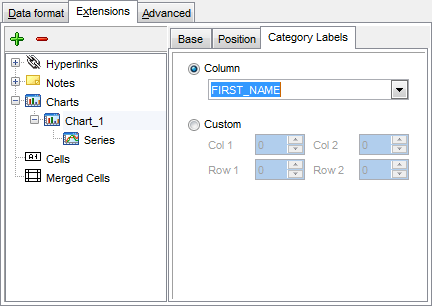
The Category Labels tab allows you to specify in which rows and columns the chart will be built.
![]() Column
Column
Use the drop-down list to select the column that will be used to take values for x-axis.
![]() Custom
Custom
Specify the range of cells from which x-axis values will be taken. Use the spinner controls to set the range you need.
To build a chart, you also need to create series that will be used to take values for y-axis. To add series for the chart:
-
add one or more series using the
 button;
- enter the titles;
- set data ranges (select a column from the drop-down list or set the custom range);
- define colors for all the graphs.
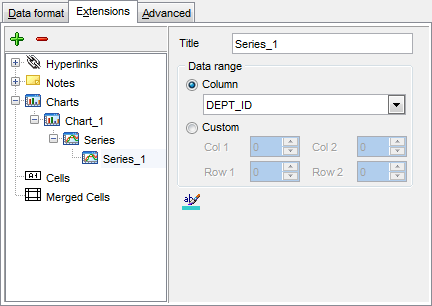
Use the Title box to specify the series name.
Data range
![]() Column
Column
Use the drop-down list to select the column that will be used to take values for the series.
![]() Custom
Custom
Specify the range of cells from which the series will be formed. Use the spinner controls to set the range you need.
Press the ![]() button to set the color for the series.
button to set the color for the series.